
Expert Salesforce Dashboard Creation services to visualize data, track KPIs, and boost decision-making with custom, insightful reports.
 Shyam Agarwal
Whether you're looking to optimize your Salesforce solution or need custom development, our team is here to help you unlock the full potential of Salesforce.
Contact Us TodayAs your Salesforce journey continues, mastering Reports and Dashboards should be a natural next step following your understanding of the Salesforce data model and of course your company’s customizations. Once you’re able to create Reports that display either standard or custom object record data based on filters and even cross-filters, you’ll be ready to move forward with showcasing them in Salesforce Dashboards.
Here, we’ll investigate the definition of a Dashboard and the different available widgets and components, as well as the process for creating your very own Dashboard from scratch.
Dashboards enable you to make decisions based on the real-time data that you have collected with reports by providing you with a visual representation of changing business situations. You can utilize dashboards in Salesforce to assist users in determining patterns, allocating resources, and assessing the results of their actions.
Dashboards in Salesforce are simply graphical representations of the report(s). It shows data from source reports as visual components. These components show the organization’s key metrics and performance indicators.
Each dashboard can have up to 20 components, and they display data as per the last time the report was run.
A single dynamic dashboard in Salesforce can display a standard set of metrics (per the user’s sharing settings) across all levels of an organization. It enables each user to see the data they have access to.
With dynamic dashboards, we can control data visibility without creating separate dashboards. A single dynamic dashboard can display a standard set of metrics across all levels of an organization.
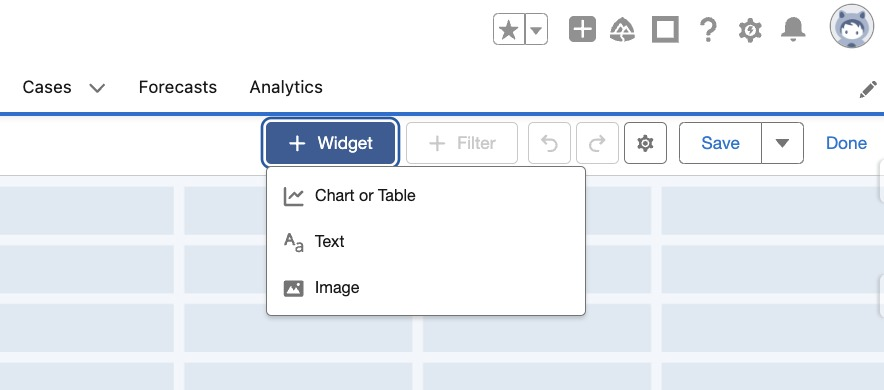
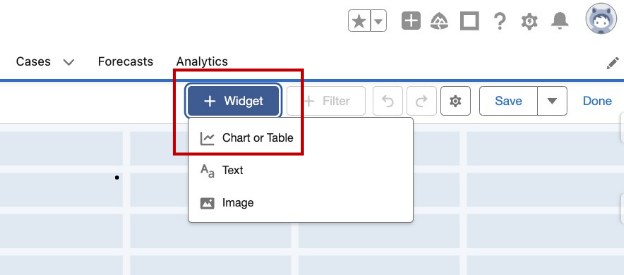
Dashboards are made up of multiple widgets which you will have to start arranging on the page once you start building one. Not too long ago you could only add charts or tables, but now there are three available widget types you can choose from:
It is easy to create dashboards in Salesforce. We have curated the step-by-step guide for you to follow:
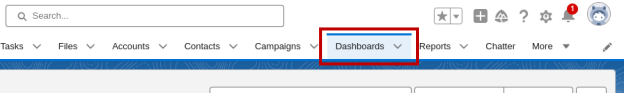
Step 1: Select the Dashboards tab
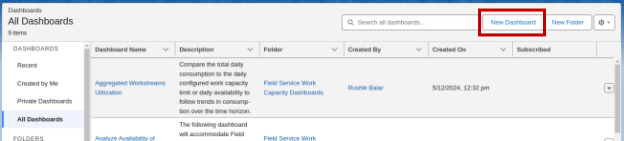
Step 2: In the upper-right corner, select New Dashboard.
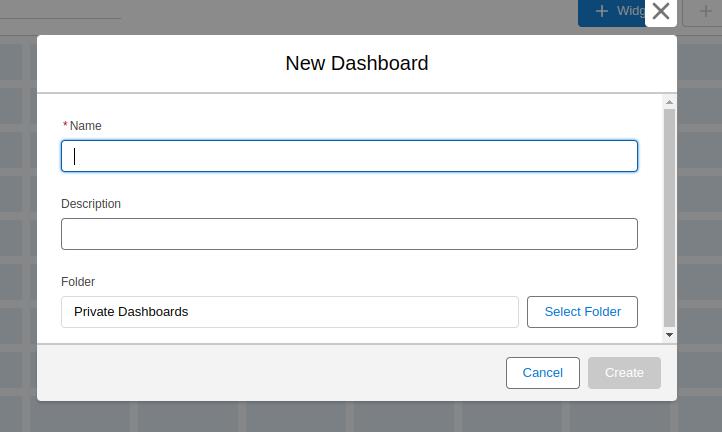
Step 3: Give your dashboard a name and choose a folder. You may also include a description if you’d like.
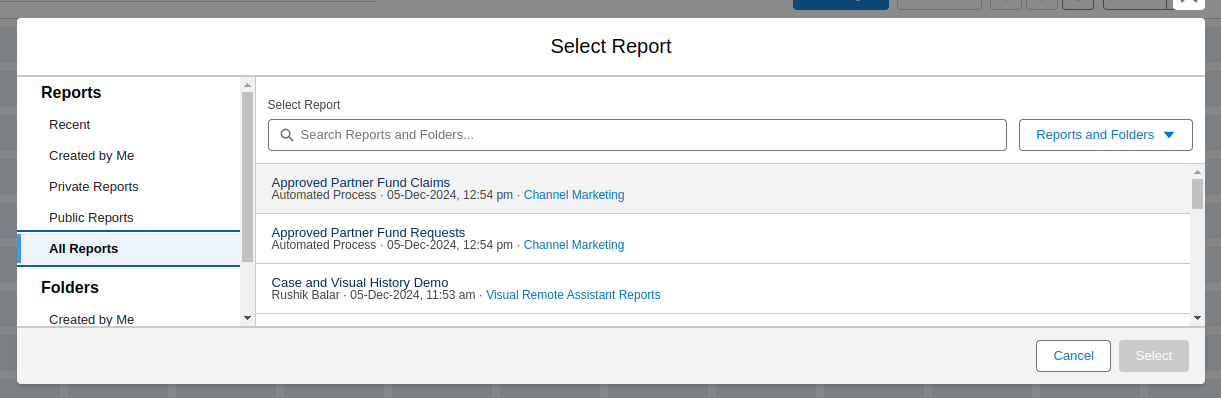
Step 4: To extract data from a report, click Add Component or Widget. Choose a chart or table from the options provided. Click Select after selecting your report of choice.
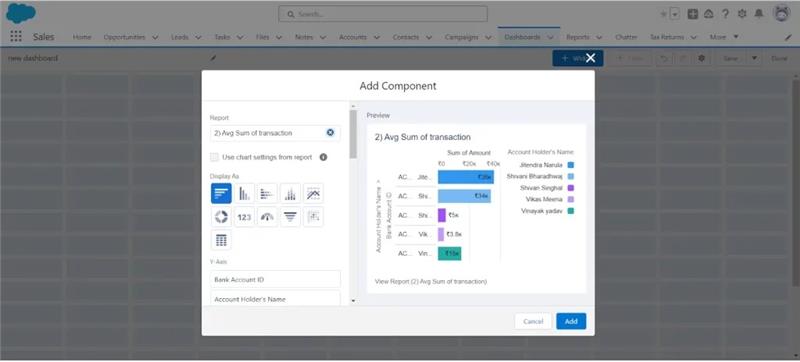
Step 5: Choose the data you want to extract from the report, add components on your dashboard, and the format you want it to appear to personalize your component. Click Add after you’re done customizing.
Step 6: Continue adding any additional elements you desire to your dashboard.
Step 7: After all your components have been inserted, click Save and then Done.
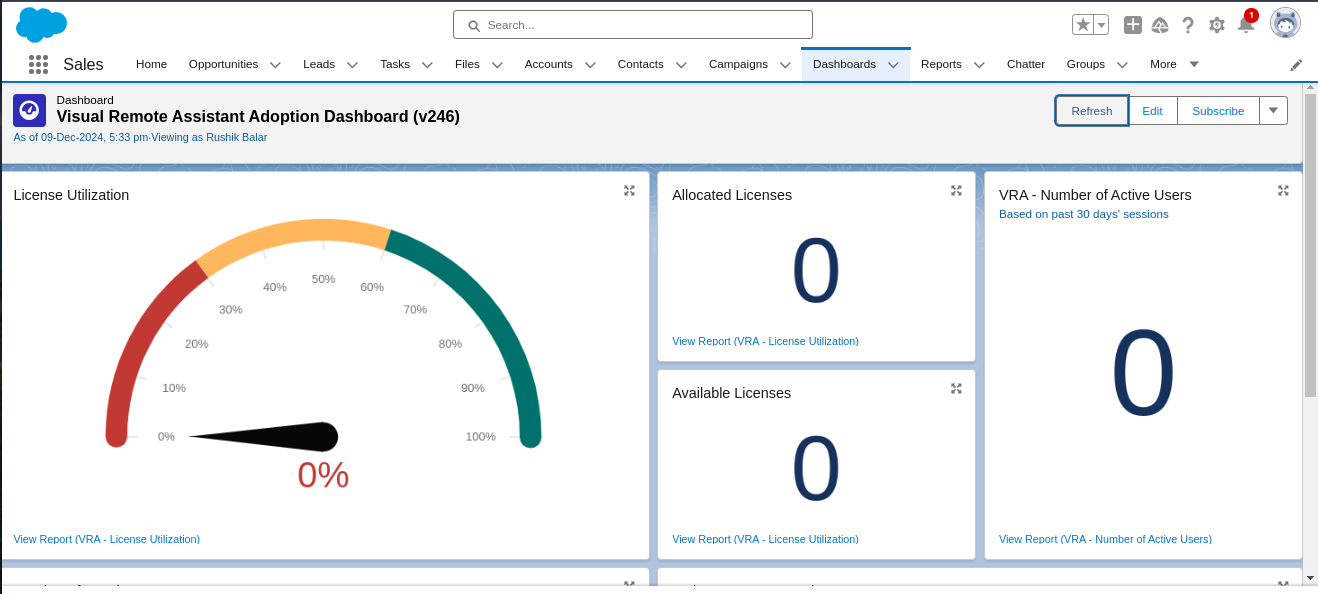
Step 8: It has generated your dashboard! Verify that everything appears as it should by reviewing your published dashboard.
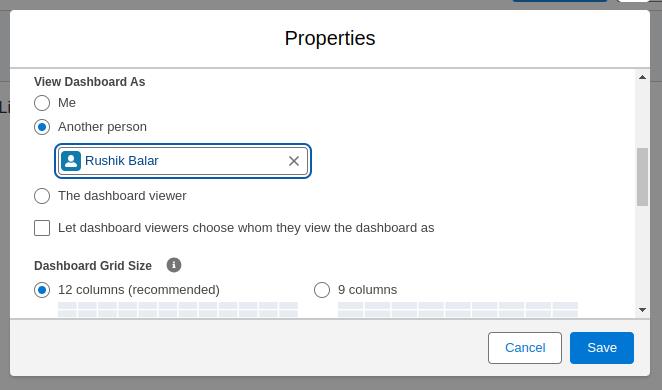
The dashboard needs someone’s security and sharing settings. In the Salesforce dashboard, let’s say someone does not have access to all the data, but the dashboard must share the settings of:
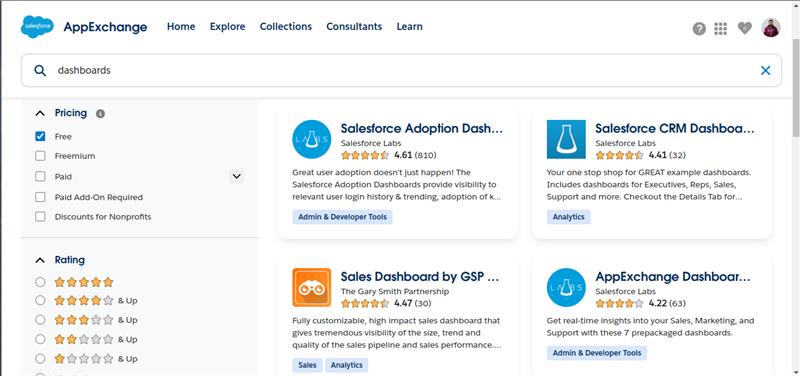
you can always explore the available AppExchange free packages.
Shyam Agarwal is an experienced technology professional with over 12 years in the industry. He has successfully delivered a wide range of projects, specializing in Salesforce consulting, development, and administration. Shyam helps businesses implement customized solutions that fit their needs, and he also has expertise in mobile and web application development. Additionally, he provides consulting services for software solutions and CRM systems, helping organizations improve efficiency and drive growth. Currently, Shyam is focused on expanding his Salesforce skills to offer even more value to his clients through effective, scalable solutions.