
Learn everything about Salesforce Reports, including Standard & Custom Report Types, report formats (Tabular, Summary, Matrix, Joined), and how to create reports using Lightning Report Builder.
 Dadhich Rami
Whether you're looking to optimize your Salesforce solution or need custom development, our team is here to help you unlock the full potential of Salesforce.
Contact Us TodayWhat is a Report? Basically, a document or statement that shows the data in organized form. Simply which means a report provides information using raw data. Reports can be delivered orally although document forms are more proffered.
Salesforce Reports are a powerful way to organize, display and analyze data stored in Salesforce. Salesforce reports are created on object/s (related objects can be used) using lightning report builder. Now, what is Lightning Report Builder? Lightning Report builder is a drag and drop tool to create/edit reports. Building reports has become very easy and quicker using Lightning Report Builder.
There are two types of Report Types: -
1. Standard Report Type.
2. Custom Report Type.
Salesforce provides some predefined report types that are called “Standard Report Type”. You can create your report using this report type much quicker and easily. Some examples of Standard Report Type: Account and Contact Reports, Activity Reports, Lead Reports, Sales Engagement Reports, etc.
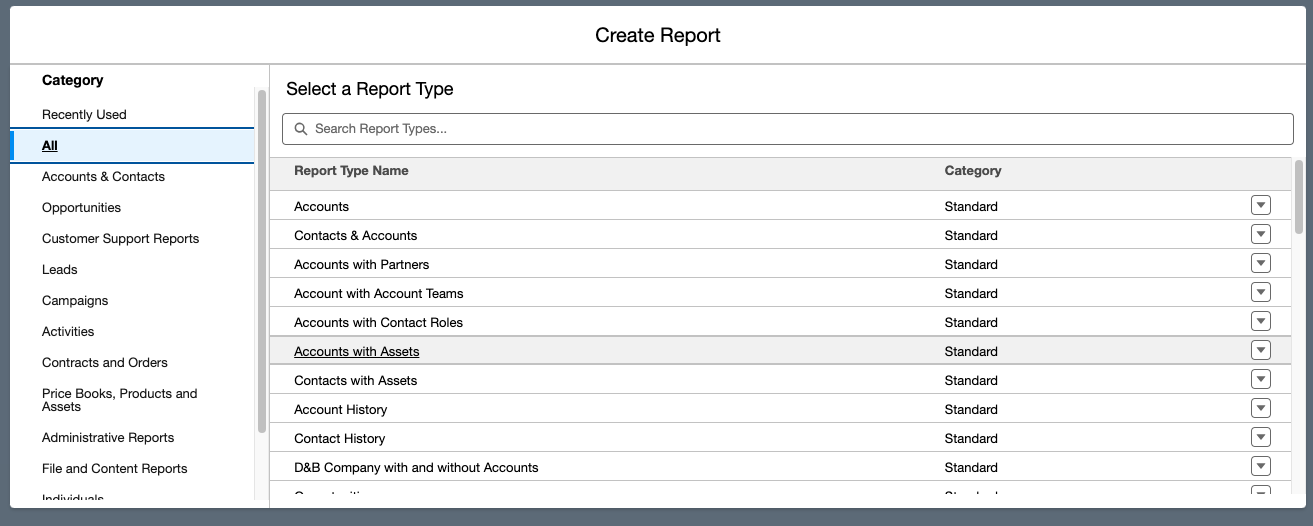
Fig - 1.1 Standard Report type example while creating report.
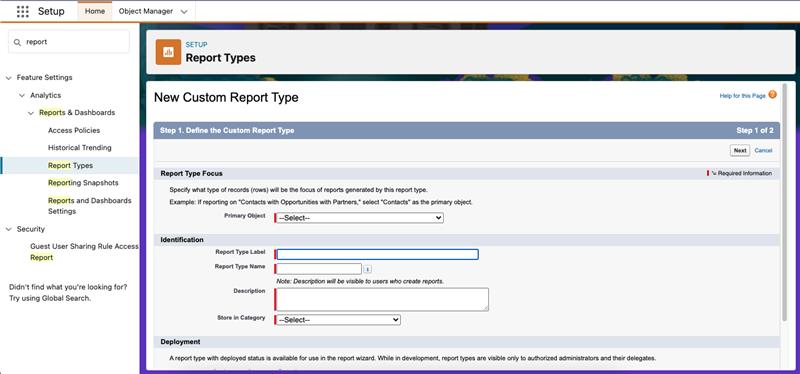
With custom report types, you can enable users to create reports from the predefined objects, object relationships, and fields that you specify. Some objects may have complex relationships so they may not be defined in Standard Report Type. For that Salesforce provides Custom Report Type. By using it you can create reports between multiple related objects.
You might get confused between Report type and types of Report. Yes, they both are different. There are 4 main types of Report in Salesforce:
The most simple and basic type of report is Tabular Report. As the name suggests, it is used to display data in a table format. It just displays the row of records in a table with a total. Tabular reports have no visualization. You can easily export this type of report. If you want to group records or create charts, you'll need to use a completely different report format. Tabular reports are suitable for simple presentation of data without features such as visualizations or grouping.
It is much like Tabular Report, once you add grouping by in tabular report it becomes Summary Report. These reports are basically used to show group data and sub totals. It allows the grouping of rows (not columns) of data, viewing subtotals, and creating charts. You can also create hierarchically grouped reports. You can also subgroup fields by dragging them under the initial group.
Once again if we add grouping by on columns on a summary report then it will become Matrix Report. Which means adding group by on Row and Column of Tabular Report. It is used when you want to view data across two unrelated types. It is quite a complex type of report.
A joined report combines multiple reports into a single view. It includes different report formats in one tab. Data in joined reports are organized in blocks. You can use different report types in each block.
To create a report just click on the report tab of your application, if you don’t see it, just click on the App Launcher and search it or add the tab to your application. Once you are in the report tab then click on the New Report Button.
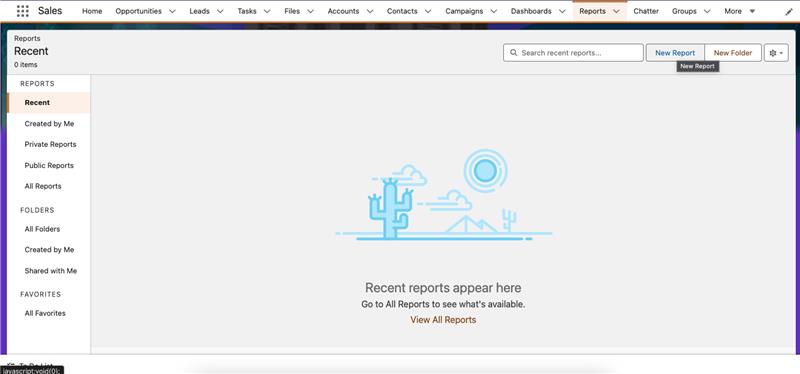
Fig - 1.3 Creating New Report from Reports Tab.
Once you click on the New Report button a pop-up window will open as shown below:
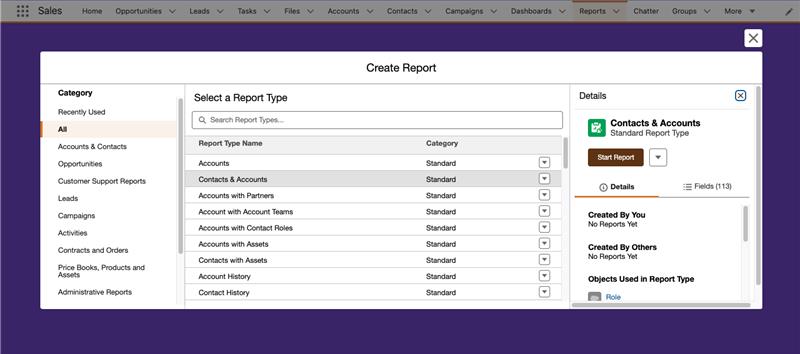
Fig - 1.4 Selecting Object or Report Type.
Select the object or report type (Standard/Custom Report Type) on which you want to create the report. Then click on the Start Report button. In this ex. I’m selecting Account & Contact (Standard Report Type).
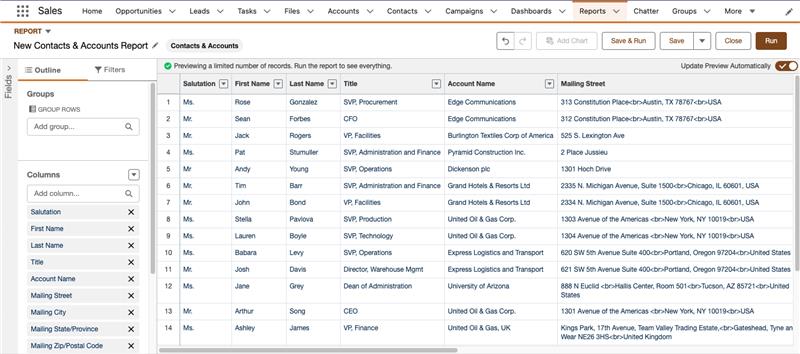
Fig - 1.5 Contact & Account Standard Report type on Report Builder.
As you can see in the above screenshot a simple tabular report in the report builder. That’s easy, no need to do anything right? Now you can customize the report as per your need. You can add columns which you want to show or add filter criteria or grouping. Once you create the report just save it by clicking save or save and run button. You can add it to the dashboard as well or you can add chart to it.
Salesforce Reports are a strong and efficient tool for organizing, displaying, and analyzing data within Salesforce. Standard and Custom Report Types allow users to create reports to suit their specific needs, from simple data presentation to complex relationships between objects. The Lightning Report Builder makes the process even easier, allowing users to create or edit reports using an intuitive drag-and-drop interface. Users can select the best format for the presentation of data by knowing the four types of reports, namely Tabular, Summary, Matrix, and Joined.
Dadhich Rami is an experienced professional with over 8 years in the tech industry, specializing in both Android development and Salesforce solutions. He began his career as an Android developer, focusing on creating user-friendly and efficient mobile applications. Over time, Dadhich expanded his expertise to Salesforce, where he has customized and optimized CRM systems to meet diverse business requirements. Alongside his development skills, Dadhich now works as a project manager, leading teams to successfully deliver projects that are on time, aligned with business goals, and equipped with the right technical solutions. With a strong background in both development and project management, Dadhich is dedicated to producing high-quality work and bringing innovative ideas to every project he undertakes.